The rainfall distribution type (I, IA, II, or III) and quantity of precipitation are required inputs to our hydrology (rainfall-runoff, peak discharge) calculation and detention storage calculation. For regions within the USA, use the figures below to determine rainfall distribution type and quantity of precipitation. For regions outside the USA, determine which rainfall distribution type best matches your region; find the precipitation quantity from local precipitation maps.
All figures are from:
U.S. Soil Conservation Service. Technical Release 55: Urban Hydrology for Small
Watersheds. USDA (U.S. Department of Agriculture). June 1986. On the web in .pdf format at
http://www.LMNOeng.com/Hydrology/TR55-Manual.pdf .
Quick links on this page:
SCS 24-hr rainfall distribution type graph
Geographic boundaries within the USA for SCS rainfall distributions
24-hr duration rainfall maps of USA with return periods of:
2-yr
5-yr
10-yr
25-yr
50-yr
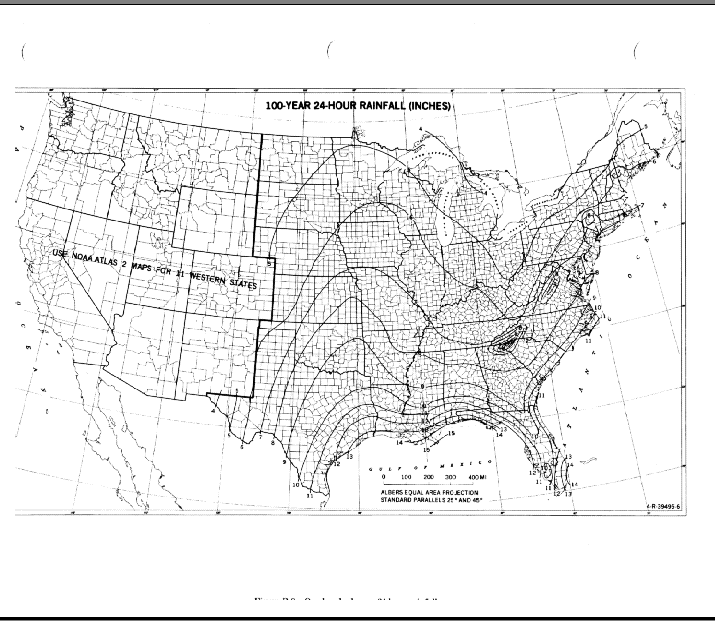
100-yr
Fig. B-1. SCS 24-hour rainfall distributions (SCS, 1986):
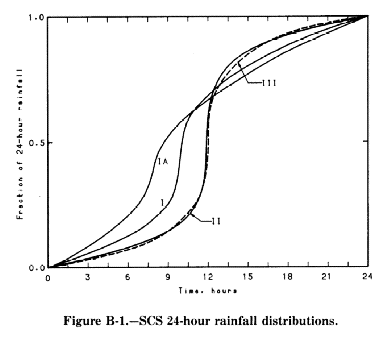
Fig. B-2. Approximate geographic boundaries for SCS rainfall distributions (SCS, 1986):
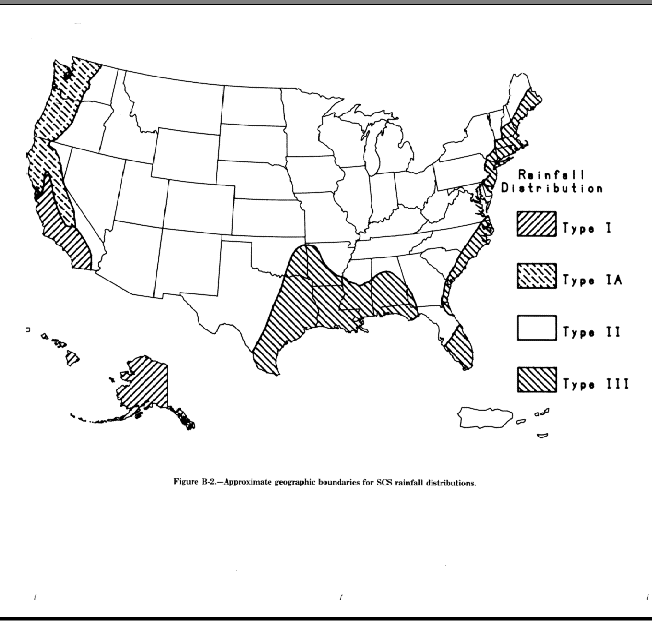
Fig. B-3. 2-Year Return Period, 24-hour Duration Precipitation, inches (SCS, 1986):
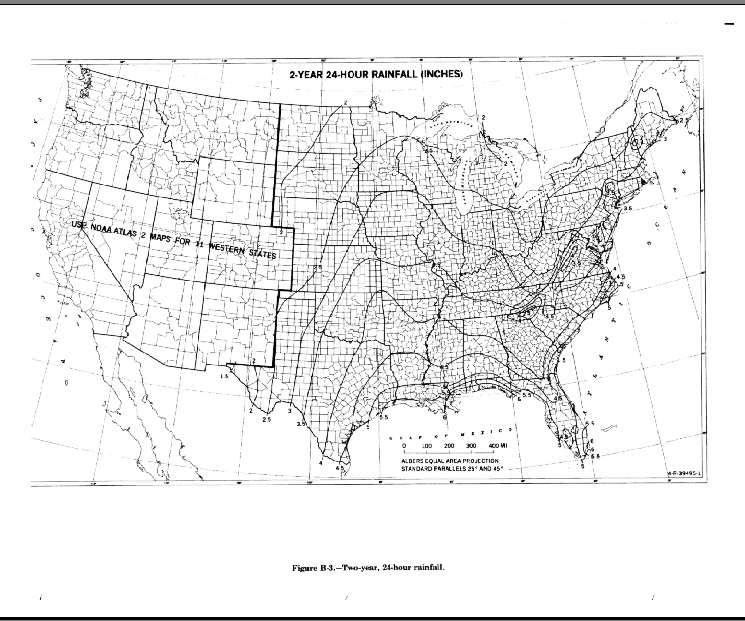
Fig. B-4. 5-Year Return Period, 24 hour Duration Precipitation, inches (SCS, 1986):
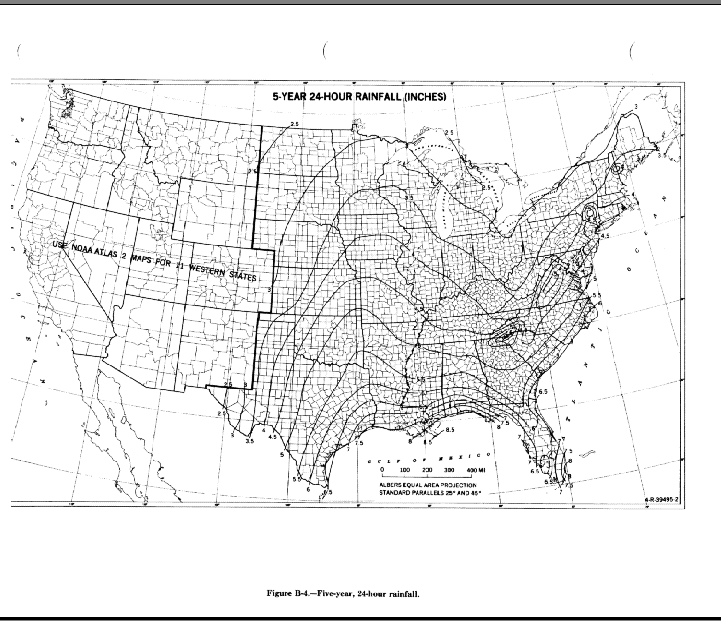
Fig. B-5. 10-Year Return Period, 24 hour Duration Precipitation, inches (SCS, 1986):
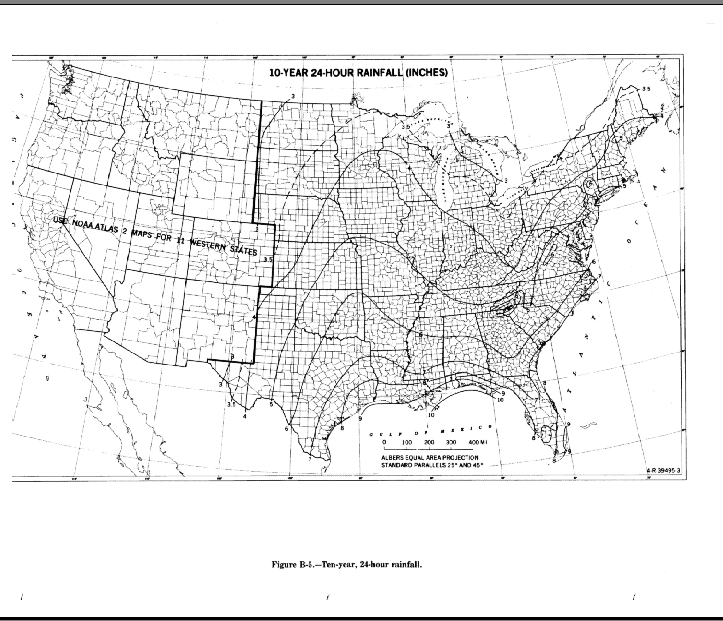
Fig. B-6. 25-Year Return Period, 24 hour Duration Precipitation, inches (SCS, 1986):
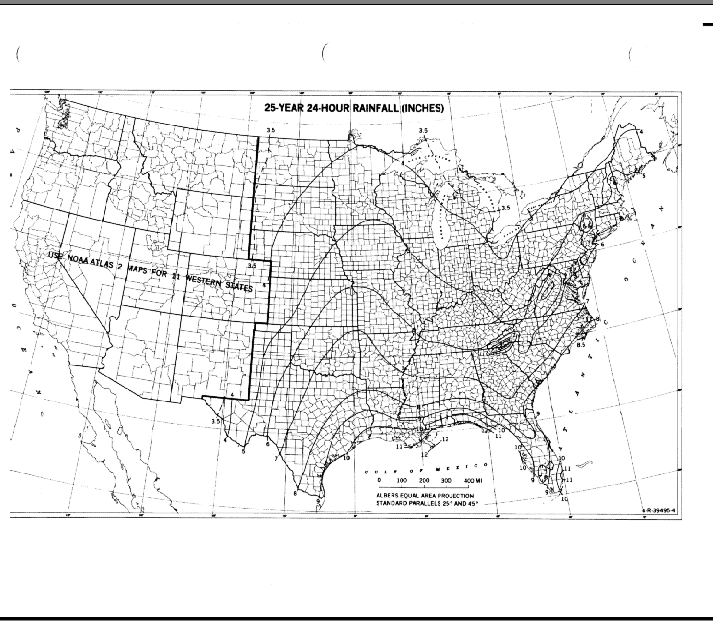
Fig. B-7. 50-Year Return Period, 24 hour Duration Precipitation, inches (SCS, 1986):
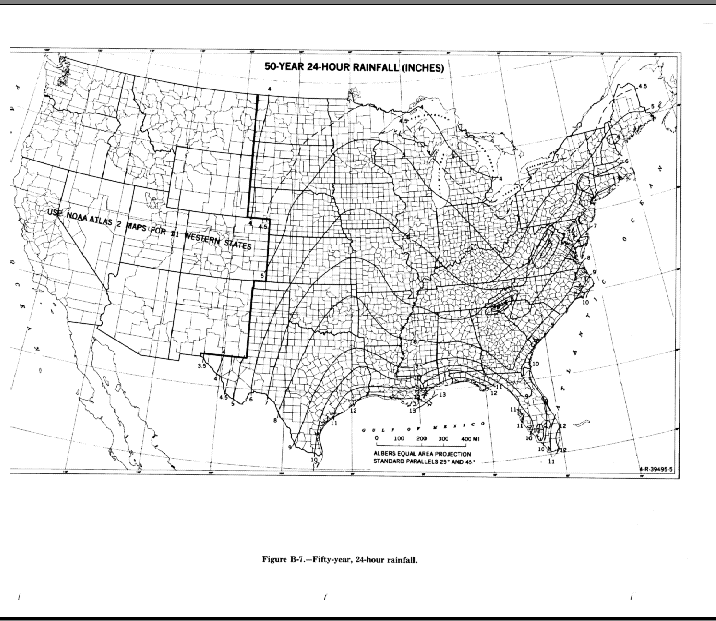
Fig. B-8. 100-Year Return Period, 24 hour Duration Precipitation, inches (SCS, 1986):
LMNO Engineering, Research, and Software, Ltd.
7860 Angel Ridge Rd. Athens, Ohio 45701 USA Phone: (740) 707‑2614
LMNO@LMNOeng.com
https://www.LMNOeng.com Reload page
